Motivation
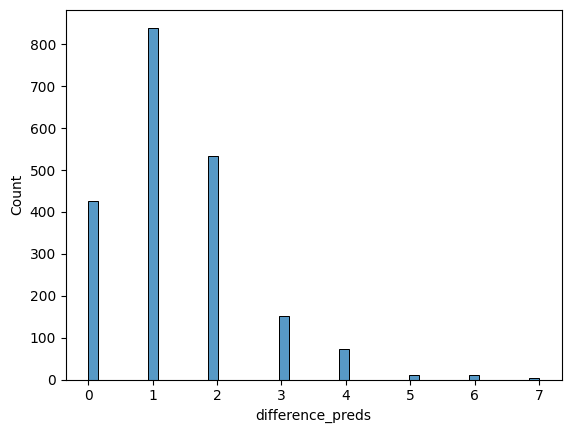
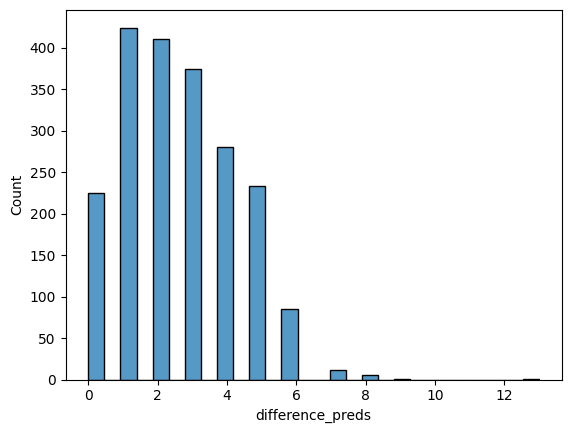
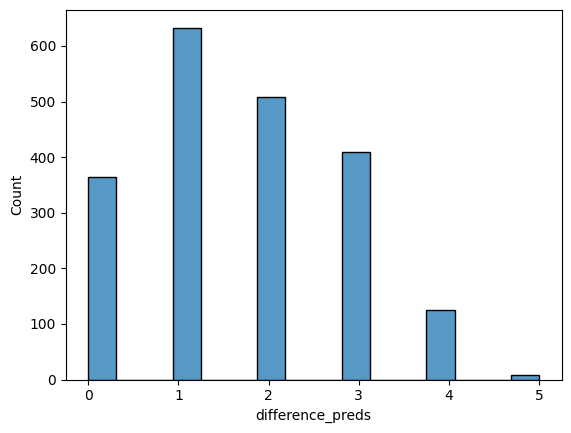
A project at work was stalled for a week and I was craving statistics work, so I chose to create this with the downtime I had. I am most proud of the missing data imputation strategy I used to predict what a missing value would have been based on the other information in that row. More precisely, I think the imputation comparison held up well. For each of five continuous fields I built a regression imputation model, chose a transformation from the shape of the distribution, and then measured it against mean-fill and median-fill on validation data. This approach resulted in a score of 0.9684, an improvement over always predicting the majority class from the dataset (~74% of records are Extroverts).
That said, this project was done for fun, and thus was never reviewed until now.
Known issues
I went back through this notebook after finishing it and found a number of errors and shortcomings. I would rather document these issues but still publish the notebook rather than leave it on the shelf; this list is everything I currently know to be wrong with it. I will mark things as resolved as I complete them.
Affects the reported results
My training and test sets both exclude records with two or more missing values, so my accuracy figure describes performance on rows with at most one missing value. The submission set does contain those rows, handled separately by median imputation. Since there are more records for Extraverted individuals, the imputations bias toward the Extroverted group.
My fallback median imputation uses the wrong variable. For submission rows with multiple missing values I fall back to median imputation, but I wrote np.median(d_tsa_ols_test_x) (design matrix) where I meant the training target. That matrix is a constant column of 1s, several one-hot dummies, and one log-transformed field, so the median across it is not a plausible value for the field I’m filling. This appears four times, on f_time_spent_alone, f_post_freq, and f_social_event_attendance. It only touches submission rows with 2+ missing values, so the effect on my score should be small, but the values it produced are wrong.
Five cells print a number labeled RMSE that isn’t RMSE. I used np.sqrt(model.mse_model). In statsmodels mse_model is the explained sum of squares over model degrees of freedom, which goes up as the fit improves, but I wanted mse_resid. That said, I still selected the imputation models on mean absolute error against mean- and median-fill baselines, the RMSE prints are just mislabeled output.
Evaluation gaps
Accuracy is the only classification metric I report, and I report no baseline. I did not acknowledge that always predicting the majority class scores about 0.74. Without that comparison — or a confusion matrix, or per-class recall — this notebook doesn’t actually demonstrate that the imputation work improved anything over a much simpler approach.
One of my two reported scores is training accuracy. model_p_1.score(d_imputed, d_train_y) scores on the data the model was fit on. The test score comes later. Both appear as bare numbers and I should have labeled which is which.
One split, no cross-validation. Everything runs off a single 80/20 split at random_state=19.
Methodological
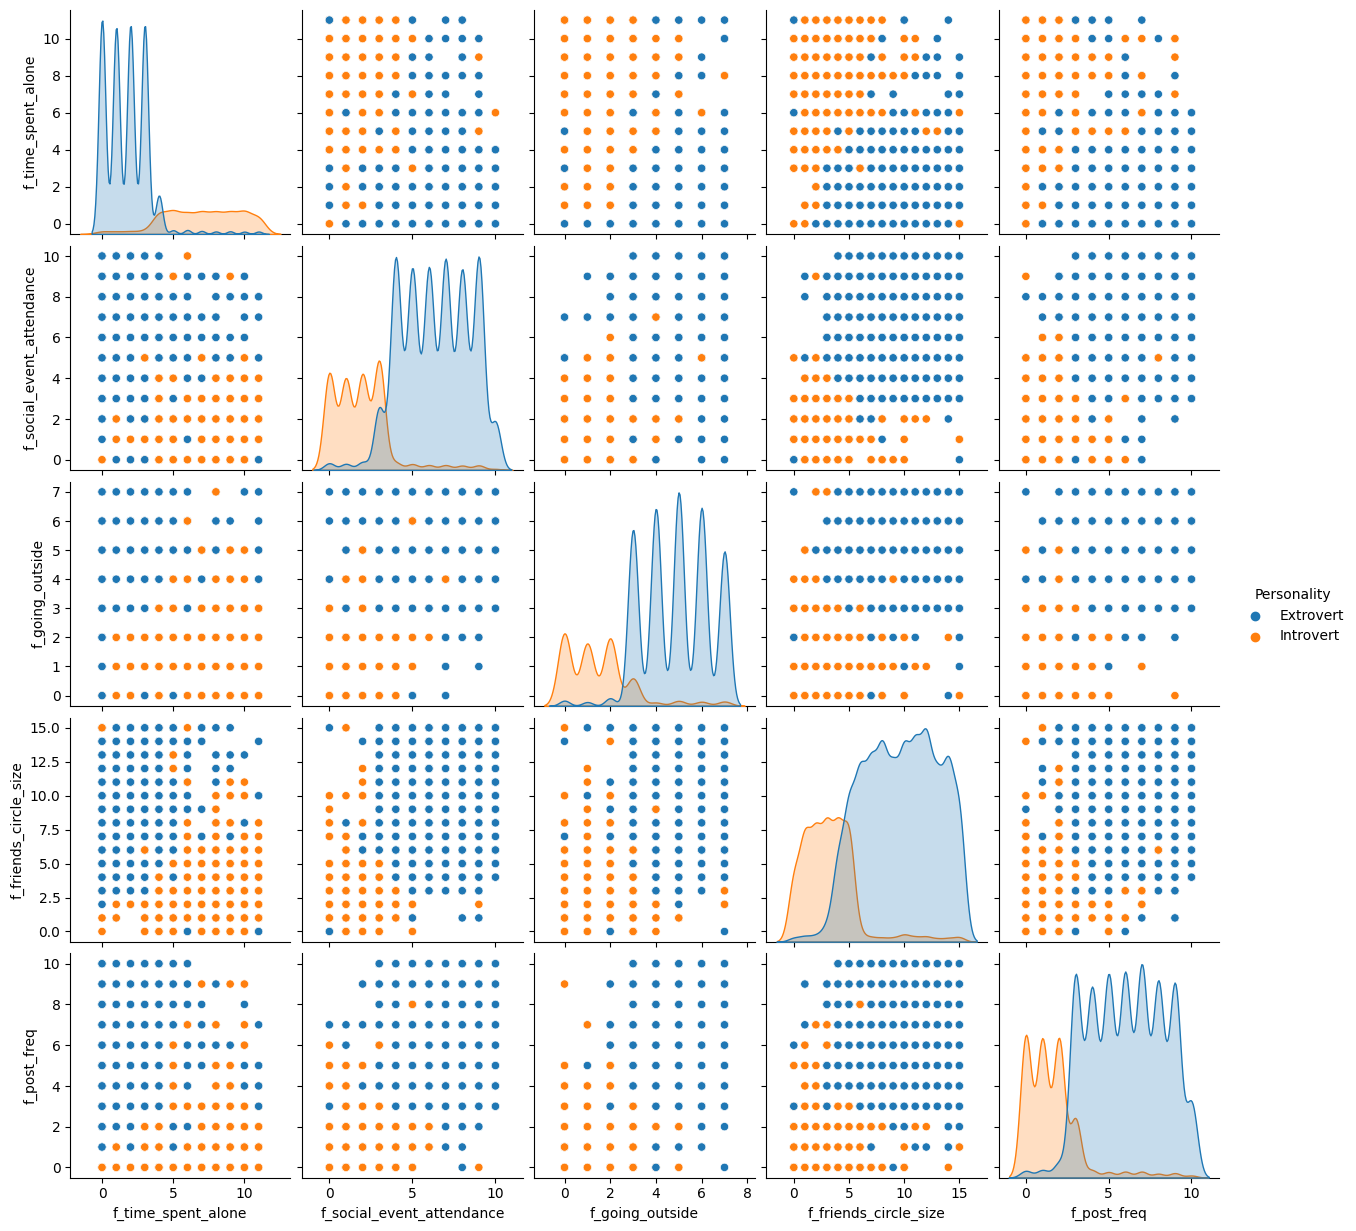
I found evidence against MAR and then used a method that assumes it. I show that introvert-labeled rows carry missing values more often than extrovert-labeled rows (about 39% vs 28%) which is evidence the data is not missing at random. Regression imputation from complete cases assumes missing at randomn; I need to consider other approaches.
I applied VIF discipline to the imputation models but not to the classifier. I iterate VIF below 5 for all five OLS models, then fit the final logistic regression on the full feature set which still contains two indicators that are nearly redundant in this dataset: d_stage_fear_yes and d_drained_after_socializing_yes.
My classifier never trains on multi-missing rows but is asked to predict on them. Each single-field imputation group is built with dropna() after removing the target column, so only rows where that field was the sole missing value survive. Multi-missing training rows are dropped silently, then multi-missing rows appear at prediction time.
No feature scaling before logistic regression. sklearn applies L2 with C=1 by default; with unscaled features on different ranges, that penalty lands unevenly across coefficients.
Feature selection happened before the split. I compute VIF across all complete training rows, then split inside each imputation model; the ordering is backwards.
Code quality
- This kind of assignment is better done with
.loc[mask, col] = ..., not: s_tsa_pf['f_social_event_attendance'][mask] = ...
- The VIF block is copy-pasted roughly four times per variable across five variables. A function that drops columns until max VIF < 5 and returns the survivors would remove a large share of this notebook’s length.
d is regex-filtered when created and d_test isn’t, so d_test still carries the original raw columns and needs an extra drop later. It works, but could be smoother.
Link to kaggle notebook